

|
|
South West Public Health Observatory |
|
| The impact of drug misuse on health in the South West, 1996-2001 | ||
|
|
National
For comparison with the national picture, the South West contained 9.9% of the population of England in 1999, and 9.3% of the proportion of 15–44 year-olds. Of the 33,093 persons (new and repeat cases) notified to the RDMDs in England, in the six months to September 2000, there were 3,247 (9.8%) who came from the South West. 6
A census by the RDMDs from April 1st 2000 to March 31st 2001, of the total numbers of problem drug users in treatment in England, revealed 118,500 persons, with 12,077 (10.2%) from the South West region. 7 Rates were calculated per 100,000 (all ages) for regional offices and ranged from 122 in the South East to 383 in the North West. The rate for England was 237 and 243 for the South West. For the under 25-year age group in treatment, the South West had the second highest rate (315) of all regions.
Regional
Results of the analysis of the South West RDMD showed 42,043 notifications of 27,886 persons presenting for treatment during the five years 1996/97–2000/01. There were 22,462 new cases, plus 5,424 persons who had been notified previously. [1] Out of the new cases 4,190 were re-notified during the five years.
Overall the numbers of notifications, persons and new cases increased during the five years, with a particularly sharp rise from 1999/2000 to 2000/01 (see Figure 2).

Figure 3 shows the changes in annual incidence rates of those with problem drug misuse presenting for treatment for the South West region, for all new cases and by gender. Rates were calculated for people usually resident in the South West and excluded cases where alcohol was recorded as the main drug. The mean annual rate for new male cases was 2.9 per 1000 males (15–44 years) [2] , ranging from 2.2 in 1996/97 to 4.5 in 2000/01. The mean annual rate for females was 1.0 per 1000 females (15–44 years), ranging from 0.7 in 1996/97 to 1.6 in 2000/01. For both sexes combined the rate rose from 1.4 in 1996/97 to 3.1 in 2000/01, an average of 2.0 per annum. It is worth noting that every 1-point rise in incidence is roughly equivalent to an additional 2,000 persons per annum in the South West.

In addition to numbers and rates for South West region residents, across the five years there were 3,081 notifications to the RDMD of 2,677 problem drug users who were normally resident outside the region. Of these 2,474 were new cases (11% of all new cases). A further 222 persons with no fixed abode were also referred.
Sub-regional
Annual incidence rates of new cases were calculated for each of the fifteen DATs in the region and are shown below in Table 2. Separate tables for males and females are provided in Appendix 2. These tables are based on people resident in the DAT area, excluding those who came from outside the region.
The overall pattern of increases in notifications to the RDMD, from 1996/97 to 2000/01 was not consistent for all DAT areas in the South West region. Bristol showed a more continuous rise during the five years and Devon showed a steep increase in numbers from 1997/98 to 1999/00, then a decrease in the last year. Bath and North East Somerset had the highest rate in 2000/01 of 5.9 per 1000, but prior to this year had an annual rate below 3 per 1000. Other areas, particularly Poole and Bournemouth made few notifications in any year.
Because the rise in annual incidence across the region, particularly for 2000/01, may in part be attributed to changes in notification practices, Figure 4 shows the mean annual rate for 1996–2001 of new cases (per 1000 of 15–44 year-olds) for each DAT area.
Bristol DAT area had the highest mean annual incidence rate (4.7 per 1000), followed by North Somerset (3.7), Torbay (3.3), and Bath and North East Somerset (3.1).

Changes in notification practice
Various changes occurred in patterns of notification between 1996/97 and 2000/01. Until 1997 there was a statutory obligation for GPs and others to make notifications to the Home Office Addicts Index, which may explain the slight drop in numbers for that year. Referrals from GPs were more frequent in 1996/97 than in 2000/01 and those from residential rehabilitation decreased by 41.6%. Subsequently there have been increasing requirements for DATs to know about problem drug users in their areas. Notifications to the RDMD from voluntary and statutory agencies more than trebled, prison notifications doubled. Similar patterns occurred nationally.

Moreover, in the year 2000/01 only, there were 2,354 persons (30%) out of 7,780 with either no information recorded about their main drug (n=1,176) and also there were higher numbers where alcohol (n=1,178) was recorded under main drug.
Together with the expansion of drug services and the setting up of new ones, some of the increases seen in Figures 2 and 3 may be explained by these factors. It is therefore difficult to determine real rates of increase in problem drug misuse from these figures.
Prevalennce
Studies conducted in Scotland, the North West and London 31,32,33 have provided estimates of the prevalence of problem drug misuse. Rates as high as 33 and 37 per 1000 were found in Liverpool and Manchester. Similarly, London Boroughs of Lewisham, Camberwell and Southwark found 31 to 36 per 1000 of the 15–44 year population with drug problems. Of these an estimated 40% were opiate users. It seems reasonable to expect similar figures for the larger urban areas in the South West. Figures for more rural areas in these studies although lower (around 20 per 1000), show a tendency for higher rates among the 15–24 year age group.
As there are nearly 2 million people in the South West [3] between the ages of 15 and 44 years, the expected prevalence of problem drug misuse, based on the above studies, would be of the order of 40,000 to over 60,000 people.
Regional estimates
The log-linear modelling approach to capture-recapture estimation of prevalence requires information on the overlap of samples from three or more data sources. In this study we used the various types of referral agency as our data sources. We examined the effect of using three sample (statutory, voluntary and GP) and four sample (statutory, voluntary, GP and residential rehabilitation) capture-recapture methods.
The exclusions from the study included individuals not usually resident in the South West, individuals of no fixed abode, individuals in prison and individuals not in the age group 15–44 years. We determined the overlap of individuals’ appearance from our sources by matching initials, dates of birth and sex; the SPSS software package was used to do this.
We also examined the effect of stratifying by year or by year and sex; thus we carried out four separate capture-recapture analyses. In each case the statistically 'best' log-linear model was identified using the S-Plus software package. The size of the unknown population could then be estimated together with the associated 95% confidence intervals. It was found that in each case the estimates were comparable; in this study we have presented the results from the four-sample method stratified by sex and year. These may be seen in Table 3.

Results show an estimated 18,463 (95% CI 15,730–21,194) problem drug users living in the South West region in 1996/97, rising to 39,103 (95% CI 36,103–43,162) in 2000/01. The regional rate for both sexes rose from 9.6 per 1000 (95% CI 8.2–11.0) to 20.3 (18.5–22.1) per 1000 over the five years, to 29 per 1000 for males (95% CI 26.6–31.4) and 11.2 per 1000 for females (95% CI 10.0–12.3).
The treatment demographic method of estimating prevalence is a product of the number of new problem users multiplied by the mean duration of problem drug use (estimated at 8 years). For the year 2000/01 this resulted in an estimate of 47,400, excluding people entering the region who were normally resident elsewhere.
The treatment coverage method estimates prevalence based on the proportion of problem drug users in treatment (estimated at 25%). For the year 2000/01 this resulted in an estimate of 48,300, including people entering the region who were normally resident elsewhere.
It seems likely therefore that the prevalence of people with drug misuse problems in the South West is at least 40,000 and may be higher than 48,000 and a rate of 20 to 24+ per 1000 of the 15–44 years of age group.
The mean age of all new cases reported to the RDMD for the five years in total was 28.3 (SD 8.8) years, ranging from 27.1 years in 1996/97 to 30.0 years in 2000/01. The age and gender of new cases for 2000/01 are shown in Figure 5, and are similar to those for England.

The gender ratio, for all years was approximately 3:1 males to females, apart from 1998/99 when it was 4:1. The mean age for males was 28 years, ranging from 27.5 in 1996/97 to 29.9 in 2000/01. For females the corresponding figures were 27.4 years, ranging from 26.8 to 30.2 years (1996/97 to 2000/01).
Age of first use, age of first problems and age of first notification
The mean reported age of first using drugs was 15.5 years (SD 4.4), 15.3 years for males and 16.0 years for females. This age decreased slightly for new cases across the five years, from 15.8 in 1996/97 to 15.5 in 2000/01. The mean reported age of using the main drug of choice was 19.5 years (SD 6.3), 19.3 years for males and 20.0 years for females. This age varied little across years. The mean age of drugs first becoming a problem was 20.1 years (SD 6.1), 20.1 years for males and 20.3 years for females. This age increased for new cases across years, from 19.5 years in 1996/97, to 20.6 years in 2000/01. Thus on average there was a five-year delay between first reported drug use and first reported problems, but as may be seen in Figure 6 this lag decreased as age of first use increased, up to the 40 to 44 years of age group, when it lengthened.

Given that the mean age of first notification was 28.3 years there was on average an eight-year lag between the reported age of first problems and reported age of first notification to an agency. This lag period lessened as reported age of first problem increased, until the 40–44 year age group, when it increased, as may be seen in Figure 7.

In summary, drug use for those later developing drug misuse problems tended to start in early to mid-adolescence. Problems developed within four years, sooner if drug use started later. Help for these problems was frequently not sought, or advice not acted upon for another seven or eight years, or sooner the older the person was when their problems first developed. Exceptions to this existed for people starting to use drugs or develop drug-related problems over 40 years of age. There are no national comparisons to be made on age of first use or age of first problems, as these questions are only collected by the South West RDMD.
Young persons
In order to look more closely at young persons notified to the RDMD, analysis of the numbers of new cases, under 16 years of age and under 19 years of age, are presented in Figure 8.

The numbers for both age groups increased markedly across the five years, both for new and total cases. There was a five-fold increase in the numbers of new cases under 16 years of age, doubling their proportion of all new cases from 1% to 2.2% (1996–2001).
Numbers of new cases under 19 years of age more than doubled across the five years, their proportional share of all new cases staying around 11%. The gender ratio was similar in the younger age groups to their older counterparts.
The national RDMD reports use different age bands, but a comparison between the percentage of under 20 year olds nationally was 14% in England (range 8% London, 19% Trent and the West Midlands) and 12% in the South West. Similar patterns of increase in numbers across time were observed nationally.
Table 4 shows the eight main and second drugs for the years 1996/97 to 2000/01 combined. Poly drug use is very common, with only 46.2% using one drug.

New cases
Heroin was the most frequently reported main drug. From 1996 to 2001 there were 10,995 new cases, 56.5% of the 19,445 where a main drug was recorded. Their numbers rose from 1,749 (56%) in 1996/97 to 3,127 (58.3%) in 2000/01, a 79% increase.
Amphetamine was used as a main drug by 12.4% of new cases overall, falling from 14.9% in 1996/97 to 6.6% in 2000/01. Cannabis was reported as the main drug in 12.4% of new cases overall, rising from 7.6% in 1996/97 to 15.6% in 2000/01. Numbers of new cases, using cocaine, crack-cocaine or ecstasy as a main drug, rose across the five years, but together accounted for less than 10% of cases.
Second drugs were reported for 10,893 new cases, the most common being cannabis, crack-cocaine, benzodiazepines and amphetamine.
Further analysis of other drugs used showed that whilst crack-cocaine was the main drug for 2.8% of new cases, it was used by 22.9%, numbers rising from 614 in 1996/97 to 1,736 in 2000/01, a 183% increase. In contrast to these increases 23.8% of new cases used methadone, numbers remaining static (1,177 in 1996/97 to 1,188 in 2000/01).
Repeat cases
With respect to the 8796 repeat cases in the five-year period, 71.9% used heroin as a main drug, rising from 58.2% in 1996/97 to 79.0% in 2000/01. Second drugs were reported for 5,528 repeat cases, the most common being benzodiazepines, cannabis, methadone and crack-cocaine.
Further analysis of other drugs used showed heroin being taken by 89% of repeat cases, numbers rising from 1,004 in 1996/97 to 3,911 in 2000/01, a 290% increase. Crack-cocaine was the main drug used by 1.8% of repeat cases, but was taken by 48%, numbers increasing from 566 in 1996/97 to 1,628 in 2000/01, a 188% increase. Methadone was used by 50.4% of repeat cases, numbers remaining static (1,027 in 1996/97 to 1,222 in 2000/01).
Many other drugs were reported as being misused, such as solvents, anti-depressants, other opioids, sedatives, stimulants, or painkillers. Prescribed medication accounted for 5% of the drugs mentioned.
National comparisons were made by combining new and existing cases where a main drug was recorded (n = 23,965). Data was compared for the year 2000/01 and showed similar figures for heroin (60% South West, 64% England), and a lower proportion of methadone in the South West (4.4% South West, 10% England). Prior to 2000/01 there was a higher proportion of amphetamine used in the region as a main drug (12% South West, 4% England), but the proportion fell to 6% in the last year. There are no national comparisons for the growth in crack- cocaine use.
In the South West region, as elsewhere in the country, there have been considerable increases in the number of new cases of problem drug misuse whose main drug is heroin. Heroin use has also become more widespread amongst repeat cases, and crack-cocaine usage has risen substantially for both new and repeat cases. There has been a decrease in amphetamine use and static methadone consumption.
New cases
There were 20,019 new cases where the route for using their main drug was recorded. For the years 1996/97 to 2000/01 overall, 8,867 (44.3%) of these injected. In 1996/97 this proportion was 42.5%, rising to 50.8% the following year, then gradually falling to 39.7% in 2000/01. The proportion of new cases who had ever injected (56.4%), or had ever shared injecting equipment (25%), showed little variation across time. Of the new cases who injected 1,015 (10.6%) shared injecting equipment, and 845 (8.4%) had done so within the previous four weeks.
Repeat cases
For repeat cases, there were 8,748 persons where the route for using their main drug was recorded. For the years 1996/97 to 2000/01 overall, 59.4% injected, with little variation across time. The proportion of repeat cases who had ever injected was 75.7% rising from 61% in 1996 to 81% in 2000/01. The numbers who had ever shared injecting equipment were 3,099 (41.6%) overall, rising from 218 in 1996/97 to 1,509 in 2000/01, a 592% increase. There were 530 (10.4%) who had shared in the previous four weeks, rising from 14 cases in 1996/97 to 290 in 2000, a 2,000% increase.
Concerning young persons, of new cases under 19 years, heroin was the main drug for 43.6%, 32% had injected and 11% had shared injecting equipment.
A summary of results for this section is provided in Table 5, including figures for those who were drug free at the time of notification (22.6% of new cases and 18.9% of repeat cases).

National comparisons were made by combining new and existing cases and where data was available on whether they had ever injected (n=24,407). Data was compared for the year 2000/01 and showed 64.7% of cases in the South West had injected at some time and 66% in England. The percentage of all cases who had ever shared injecting equipment was 40.7% in the South West and 50% in England.
In summary new cases have shown a recent slight decrease in the proportion of people injecting on a regular basis, but both new and repeat cases have substantial numbers who have shared injecting equipment. More repeat cases inject or share injecting equipment than new cases and have become increasingly likely to do so during the past five years.
The high numbers of notification forms which are incomplete for these sections provide limited information on children, housing, employment and ethnicity. All analyses are based on 27,886 individual persons for the five years in total. It was difficult to gauge the numbers of incomplete forms, because these fields tended to be filled in if an individual met the criteria e.g. 'pregnant' ='yes' or simply left blank, rather than a definite 'no'.
Children
Table 6 shows 2,703 (9.6%) problem drug users who were parents, plus 169 who were pregnant. A total of 4,993 children were involved, 21.8% who were living with their parents, 75.7% living separately and 2.5% in care.

Housing
Completed information showed 1,586 (5.6%) homeless, and a further 3,140 (11.3%) whose housing situation was not secure.
Employment
Completed information showed 12,291 (46.3%) as unemployed. Of those whose employment was described, 365 were noted as 'child rearing', 581 in 'formal employment', 510 as 'other', and 317 as 'sex industry'.
Ethnicity
There were 20,485 who were described as 'white', 272 as 'Black' (African, Caribbean or Other), 135 'Asian' (Indian, Pakistani, or Other), and 3 'Chinese'.
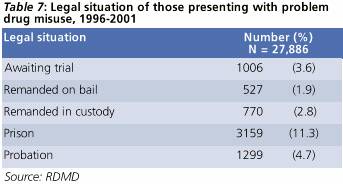
Legal situation
Table 7 shows various types of legal situation, with 3,929 (14.1%) of all persons (n=27,886) notified, in prison or remanded in custody. Of the 22,462 new cases, 2,731 (12.2%) were referred from prisons. The Home Office is currently evaluating the Arrest Referral Scheme, but data was not available for this study.
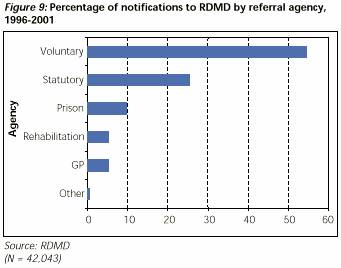
Over 80 agencies made notifications to the RDMD during the five years. Information was not available on the source of referral for over 11,000 persons. The majority (54.5%) came from voluntary organisations providing drug services, followed by statutory agencies (25.3%) and prisons (9.6%) (Figure 9). Rehabilitation services in the region made 1,714 notifications of 1,416 persons. Concerning repeat cases, 79.6% were notified by different agencies. As described under 'Changes in Notification Practice' (p7), there were fewer notifications from GPs in 2000/01 than in 1996/97 and a drop of over 40% in notifications from residential rehabilitation over the five year period. At the same time, there was a threefold increase in notifications from voluntary and statutory agencies, and twice the number of notifications from prisons.
Although GPs notified a total of 1,405 persons directly to the RDMD, examination of who referred problem drug users to the drug agencies revealed that 4,783 persons were sent by their GPs. A total of 5,551 persons approached the specialist drug agencies themselves and the police, probation or other legal sources referred 2,599 persons.
With regard to the types of drug problems the agencies were dealing with, voluntary agencies tended to see more young people than other agencies and more people with cannabis dependency, more cocaine users, fewer heroin addicts and fewer people who had ever injected.
There were 8,153 notifications (of 4,708 persons) from prisons across the five years. Of these 59.7% were made by voluntary drug agencies visiting the prisons. Table D in Appendix 2 provides a detailed breakdown of these notifications from each prison in the region. HMP Horfield in Bristol made the most notifications (3,541) [4] , followed by HMP Exeter (1,013) and HMP Dartmoor (836). [5] HMP Eastwood Park female prison made 673 notifications of 448 persons. There were 3,547 new cases (16.1% of new cases) notified from prisons, not previously known to the RDMD, details of which may be seen in Table E in Appendix 2.
Figure 10 shows the proportion of notifications from agencies within each health authority, with Avon predominating at 51% across the five years.

Table 8 shows the number of people with drug misuse problems resident in each DAT area across the five years, together with the numbers of persons notified to the RDMD by agencies within each area, both of their own and other areas' residents. Whilst most DAT area agencies saw mostly their own residents, it can be seen that Bristol agencies saw 4,711 persons from outside their area. These came predominantly from South Gloucestershire and North Somerset. Bath and North East Somerset agencies saw 318 people from Wiltshire, 20% of their cases, but 718 of their own residents (40.6%) were referred by Bristol agencies. These are just a few examples of cross-border flow. (See also Appendix 1 for further explanation.)
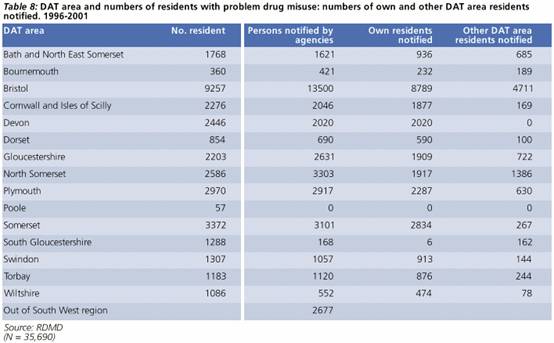
The numbers shown in Table 8 are individuals who were resident in each DAT area, during the years 1996/97 to 2000/01. The classification 'Out of region' applies to the 2,677 persons normally resident outside the region, who were notified predominantly by voluntary agencies (44%), residential rehabilitation (29%), or from prisons (20%).
Over 600 came from Wales, especially South Wales; other places of note were the Midlands and London areas, but a few people came from as far afield as Abu Dhabi and Australia. Devon DAT area notified most (29.8%) of those from outside the region, followed by North Somerset (27.2%) and Bristol (15.5%). Prisons notified a total of 272 persons from outside the region, mostly from prisons in Gloucester, Bristol and South Gloucestershire.
Of the 222 persons notified with no fixed abode, 49.1% were referred from the Bristol DAT area.
Migration of problem drug users is further demonstrated by examining repeat cases, which showed that of those people notified to the RDMD more than once, 39% came from different DAT areas to their prior notifications.
It is difficult to gauge the number of deaths from illicit drugs, partly because of the variety of substances that may have been involved, including prescribed or over-the-counter medication, and alcohol. There may also be reluctance among medical practitioners or coroners to record illicit drugs on death certificates, or acknowledge the role of drugs in accidental deaths, or deaths from misadventure. An added complication may be that the cause of death, such as cardiac or respiratory arrest may not be easily attributable to specific drugs. Furthermore, substances change in their nature after entering the system, for example heroin breaks down into morphine, and there may be a lack of clarity about how long drugs have been in the system. The following estimates are taken from ONS publications or the np-SAD study, based on returns from coroners. Further data concerning health authorities were kindly provided by ONS.
National
From 1993 to 1999, in England, there were 17,757 drug-related deaths (any drug, illegal or otherwise). 20 The majority of cases were male (76%) and under 45 years of age (77%). 20 This recent report by the ONS showed the age-standardised mortality rates for males from drug related poisoning to be 57.6 per million for England for the years 1993 to 1999. For females the rate was 28.7.
Another study by ONS 21 , of deaths in England and Wales from 1995 to 1999 found illegal drugs were mentioned on 22% of data certificates of all drug related poisoning between 1995 and 1999. This study showed an increase in the incidence of illegal drug related deaths, notably in males. In 1995 there were 11 deaths per million, rising to 25 deaths per million in 1999, an increase of 124%. Deaths from methadone decreased by 30% from 1997 to 1999. There was little variation in rates for females across the five years. Local authority areas with significantly higher or lower rates than the national average are described below.
Based on the ONS classification of socio-economic and demographic characteristics of local authorities, death rates were highest in England and Wales in ports and coastal resort areas.
Regional
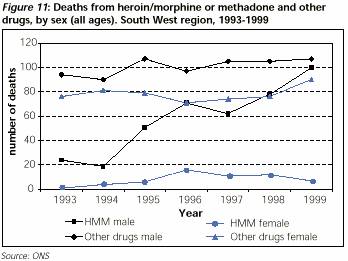
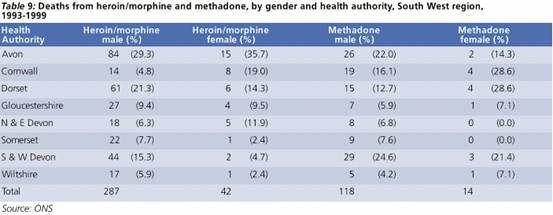
There were 1,704 deaths related to any drug (legal or illegal) in the South West from 1993 to 1999, representing 9.6% of the national figure. 20 The rate for the South West for any male drug related deaths was 45.1 per million, compared to the national figure of 57.6. For females the rate for the region was 23.0, compared to 28.7 nationally. For both sexes in the South West these rates were significantly below the national average. The data is presented only as under and over 25 years, and little difference is found by age. For comparison, rates ranged from 80.1 (males) and 38.1 (females) in the North West, to 42.1 (males) and 23.0 (females) in the West Midlands. The South West also had significantly lower rates of methadone (both sexes) or cocaine related deaths (males only) than for England as a whole. The increasing number of male deaths nationally, associated with heroin and morphine, was reflected in the South West and may be seen in Figure 11.
For comparison, according to the np-SAD (St. George's Hospital) study of drug related deaths in England and Wales there were 373 deaths reported by coroners in the South West, from July 1997 to June 2000. 22 Over 70% of cases had a history of illicit drug use and opiates were implicated in over 60% of deaths. Multiple prescriptions were reported in 60% of cases and 50% had prescribed medication involved in their deaths. Methadone deaths accounted for 12% of all drug-poisoning deaths. It is difficult to gauge changes in time from this study because of the varying numbers of coroners reporting.
Sub-regional
The ONS examined local authorities with death rates related to drug misuse over 1993–9 significantly higher or lower than the national average. In the South West, Bournemouth had the second highest rate (73.0) in England and Wales for heroin and morphine related deaths, behind only Blackpool (112.4). Other significantly higher areas in the South West were Bath and North East Somerset (34.8), Plymouth (28.0) and Bristol (26.1). Plymouth also had a significantly higher rate for methadone related deaths (21.9). These figures pertain only to males.
Regarding areas in the South West with significantly lower rates than average, East Dorset, North Wiltshire and South Gloucestershire had relatively fewer heroin and morphine related deaths. Bournemouth, South Gloucestershire, Teignbridge and Taunton Deane had fewer methadone related deaths.
Table 9 shows the numbers of heroin/morphine or methadone related deaths for each health authority in the region, from 1993 to 1999. The percentages shown are the proportions of each column total, therefore percentage of regional numbers. Because of the very small numbers in some categories, caution should be exercised in interpretation.
The NHS South West Regional Office provided details of the volume of prescriptions for methadone, covering the period August 1999 to July 2000 from PACT data. Overall 5,711 prescription items of methadone were made per month with little overall variation during the two-year period as can be seen in Figure 12.
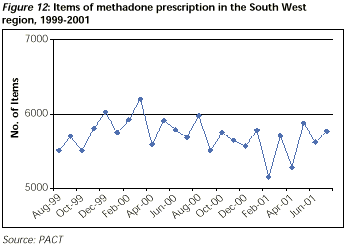
However, there were differences in the numbers of prescriptions between the eight health authorities in the region, unrelated to population size or numbers of problem drug users, as notified to the RDMD.
Table 10 shows the percentage of monthly prescription items per health authority (HA), compared with each HA's percentage of notifications to the RDMD. Avon, with 20.4% of the population of the South West had 51.3% of notifications and 49.8% of methadone prescriptions. In contrast, Cornwall had 10% of the population, 4.4% of notifications and 0.5% of methadone prescriptions. Dorset, with 14% of the population made 3.3% of the notifications, but 11.3% of methadone prescriptions.

During the two years, prescriptions for methadone varied within HAs as well as between them. Avon saw a rise of 18%, whilst North and East Devon saw a 72% decrease.
Caution must be exercised in interpreting this data as PACT data will reflect only methadone prescribed by GPs in the community and does not include methadone prescribed in hospitals, and will therefore be an under-estimate of total prescribing. Furthermore, the figures do not represent the volume of methadone prescribed, only the number of prescriptions which may vary in terms of dosage.
This section contains information related to admissions to hospitals for overdoses associated with problem drug misuse. The data may not reflect the greater numbers of people who either overdose without admission to hospital, or those who are in the community, treated or not, for associated psychiatric conditions.
National
According to the Hospital Episode Statistics (HES) database, in England from 1995/96 to 1999/00 there were 27,578 hospital admissions for accidental or deliberate self-poisoning, where the main cause was a narcotics overdose, an average of 5,515 per annum. There was an increase in admission numbers for England across the five years, with the gender ratio staying similar at 40.8% females, 59.2% males (see Figure 13). Clinical judgement deemed 36.8% of these overdoses to be accidental and 63.2% deliberate, the cause of the majority (58.7%) being associated with heroin or other opiates.
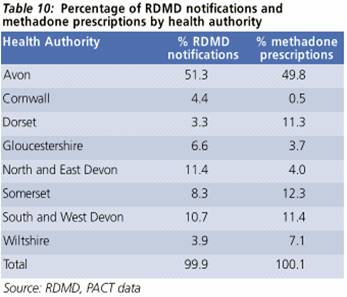
Figure 14 shows a somewhat different trend for the South West with the gender ratio closing up to 1997/98, then starting to slightly diverge again in 2000/01.

Regional and sub-regional
Table 11 shows the proportion of recorded narcotics overdoses and psychiatric admissions for each HA in the South West. Apart from South and West Devon (greater than) and Wiltshire (less than), the HAs in the South West region admitted people for narcotics overdoses proportional to population (data not shown).

National
Based on HES data for psychiatric hospital admissions, Figure 15 shows the numbers of admissions in England from 1995/6 to 1999/0 for 'mental and behavioural disorders due to psychoactive substance use'. These totalled 7,806 in 1999/0, an increase over the five years of 19.7%. Most (84%) were associated with heroin or poly-drug use. The remainder was admitted for amphetamine, cocaine, hallucinogen, or other drug use. Females accounted for 28–30% of admissions across the five years.

Regional and sub-regional
Comparison between England and the South West showed 10.4% came from the region, with a similar gender distribution.
Referring back to Table 11, apart from Dorset (greater than), Somerset and Wiltshire (less than), the South West HAs admitted people for psychiatric care of drug abuse problems proportional to population. It is worth noting that Dorset had the highest number of psychiatric admissions for heroin abuse in the South West and the ratio of females to males was 44.7% to 55.3%.
Interpretation of these figures is difficult, as pyschiatric admissions may reflect local access and service provision, particularly for those with duel-diagnosis.
HIV/AIDS
Since 1998 the number of new HIV diagnoses attributed to injecting drug use has remained about 150 per year in England, Wales and Northern Ireland, in contrast to Scotland where 36% of AIDS cases have been related to injecting drug use.
Of 18,392 existing HIV infected patients in England in 1999, 723 (3.9%) were from the South West region, with an estimated 50 caused by injecting drug use.
The unlinked anonymous prevalence-monitoring programme conducted by the PHLS and Institute of Child Health reported in November 2000. 27 Out of 1,389 injecting drug users tested in the South West in 1998/99, three cases were HIV positive, giving a prevalence rate of 0.2%, compared to 3.0% in London.
Hepatitis B
The anonymous prevalence programme described above identified 212 (15%) out of 1,389 drug users with hepatitis B in the South West, falling from 29% in 1992/93, when 275 out of 951 drug users were infected. Across England and Wales, rates varied from 33% in the North West to 6% in the Northern and Yorkshire region.
This study also reported on prevalence of sharing injecting equipment, with 39% sharing in the South West, varying from 22% in the North West to 40% in London.
Regarding immunisation it was further estimated that 29% of injecting drug users had received hepatitis B vaccine.
Hepatitis C
In contrast to the apparently stable situation described above concerning HIV/AIDS and hepatitis B, there has been an epidemic of hepatitis C among injecting drug users in the UK in recent years. From 241 cases in England and Wales in 1992, there were 5,108 cases in the year 2000, an increase of 2,000%.
There were an estimated 929 cases in the South West in the year 2000, compared to 23 in 1992. The growth in numbers can be seen in Figure 16 and represents 17.5% of cases in England for the five years 1995 to 2000. Furthermore access for testing is inconsistently provided by drug agencies in the South West.

The anonymous prevalence programme 27 identified 336 infected cases (24%) out of 1,389 drug users in the region. In relation to the other regions in England this compared to 48% in London, 46% in the North West, 18% in Wales and 14% in Northern and Yorkshire.
Following the establishment of a dedicated maternity service for pregnant drug misusers in Bristol, in 1993 an audit was conducted and repeated again in 1997/98. 34 The results showed an increase in the number of mothers using the service from 15 to 69 per annum. Two thirds of the neonates born in 1993 required neonatal intensive care for neonatal abstinence syndrome, compared to one third in 1997/98. Rates for neonatal death, premature delivery and caesarean section were reduced. These and other positive results have demonstrated the benefits of such a service for the reduction of neonatal complications of addiction.
Road traffic accidents
A recent study by the Transport Research Laboratory 35 compared the presence of drugs and alcohol in road accident fatalities with a previous study, between 1985 and 1987. The earlier study found 7.4% of fatalities having traces of medicinal drugs or illicit drugs, and 35% of alcohol. Between 1996 and 2000, samples were taken from 1,184 fatal casualties and found at least one medicinal or illicit drug in 24.1%, and alcohol in 31.5% of cases. Of those in the recent study, 17.7% tested positive for a single drug and 6.3% for multiple drug presence. Only 5.3% of those with any drug presence in the earlier study had traces of multiple drug use.
Cannabis traces were the most frequently found in the single drug cases, rising from 2.6% in 1985/87 to 11.9% in 1996–2000. However cannabis remains traceable in the blood stream for up to four weeks, whereas its effect on driving is probably limited to a few hours after it is taken. The majority (89%) of those with multiple drug traces had taken a combination of two or more illicit drugs. Those who had consumed drugs were no more likely to have consumed alcohol, than those who had not used drugs.
The pattern of drug consumption between the sexes differed considerably according to age. In males, the majority of single or multiple drug use was in those aged under 40 years. In females the majority of drug use was in those aged 40 and over, with a much higher incidence of medicinal drug use in females, and illicit drug use in males. Drug use was highest amongst those fatalities reported as being unemployed (38.5%).
Males made up the substantial majority of the cases (82.7% in 1996 to 2000, 74.3% in 1985/87).
Regional comparisons were made in the recent study and Table 12 shows figures for the South West compared to averages for the whole of the UK. The national average for cases with traces of multiple drug use was 6.3%, ranging from 3.1% in Scotland to 8.2%, the highest, in the South West.

Environment
The Beachwatch survey 36 in the year 2000 recorded on average one syringe/needle discarded per kilometre of beach in the UK. There were no more detailed analyses by region.
[1] For definition of notification, persons and new cases see Appendix 1.
[2] Over 95% of people with drug misuse problems are 15-44 years of age, hence rates are calculated according to this age group.
[3] Based on population estimates for the South West region there were 1,961,436 persons between the ages of 15 and 44 years in the year 2001. (Source: ONS) .
[4] Notifications from HMP Horfield rose from 623 in 1996/97 to 1,181 in 1999/00, the fell to 379 in 2000/01.
[5] Notifications from HMP Dartmoor rose from 0 in 1996/97 to 185 in 1999/00, then doubled in 2000/01.