2 Methods
2.1 HES data
HES data for England (source: Department of Health) were available for the financial years 1995/96 to 1999/2000. We have used data on admissions. Hence, if an individual is admitted more than once in a financial year that will be recorded as two separate admissions. These data thus reflect the use of services as a whole, rather than individuals' patterns of care. Admission rates (age-standardised to the European Standard Population) were calculated using the mid-year population estimates, derived from 1991 census data, as the denominator. The analysis was restricted to subjects aged 16–64 years. This is because older patients tend to have considerable co-morbidity and they tend to be cared for in a wider variety of settings (e.g. care homes, nursing homes). We thus restricted the analysis to the age group mainly covered by the adult psychiatry specialty.
Patterns of admission and length of stay were extracted for all admissions under the specialties: mental handicap, mental illness, child and adolescent psychiatry, forensic psychiatry, psychotherapy and old age psychiatry (HES field code "Mainspef"; codes used: 700–715). Forensic admissions, which constitute less than 1% of the total, were excluded from some analyses where it was thought that they had the potential to skew the results. As well as overall trends (all diagnoses), patterns of admission and length of stay were also examined in relation to the following broad diagnostic groups using ICD-10 codes for the main diagnosis:
-
a. Organic disorders (ICD-10: F01–F09)
-
b. Substance misuse (ICD-10: F10–F19)
-
c. Schizophrenia andrelated psychoses (ICD-10: F20–F29)
-
d. Mania and bipolardisorders (ICD-10: F30–F31)
-
e. Depression and anxiety (ICD-10: F32–F49)
-
f. Eating disorders (ICD-10: F50)
-
g. Other (ICD-10: F51–F69, F99)
2.2 Data extraction and management
Duplicate records were removed from the data extracts by matching on a number of the data fields (i.e. age, sex, health authority of residence or main diagnosis). Due to missing data on the sex of the subjects for 1.6% of records, sex-specific analyses were restricted to the remaining 98.4% of episodes.

3 Results
3.1 Patterns of psychiatric inpatient admissions by region, age, gender, and diagnostic group
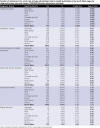
The age-standardised annual rate of admissions for psychiatric disorders in England for ages 16–64 was 3.2 per 1,000 for the 1995/96–1999/2000 period. Over these five years there were over half a million psychiatric admissions in England, and some 59,000 in the South West region. On average, there were 104,000 admissions per year in England, and 12,000 per year in the South West. Figures vary considerably by region. Rates were highest in the North West (4.3 per 1,000) and South West (3.8 per 1,000), and lowest in the Trent and Eastern regions (2.8 and 2.3 per 1,000 respectively).
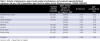
Table 1: Number of admissions, mean annual number of admissions and crude and age-standardised admission rate per 1,000 of population, ages 16-64, by region and England, persons, 1995/96 - 1999/2000
Table 2 shows how admission rates vary by age group in England and the South West. Looking first at England as a whole, for males, admission rates peak in the 25–34 age-group, and then decline. For females the rates are slightly less variable by age, and are highest in the 35–44 age group. Focusing on the South West, we can see that the rates are higher than for England. The peak is in the same age-group for men (25–34) but for women rates are at their peak in the 25–34 rather than the 35–44 age group.
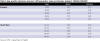
Table 2: Age-specific admission rates per 1,000 population, males and females, England, 1995/96 - 1999/2000
Table 3 shows the total number of admissions by diagnostic group for England and the proportion of total admissions accounted for by each group. Although for the South West the proportions vary slightly from those for England, the overall pattern is broadly similar. Depression/anxiety is the commonest reason for hospital admission accounting for around a third of admissions, followed by schizophrenia and related psychoses which accounts for approximately a quarter. Mania and bipolar disorders account for about a tenth of admissions, substance misuse a fifth; the smallest proportion is taken up by eating disorders. The 'other' category, accounting for a little over 10% of the total, will include personality disorders, non-dependent drug misuse and those not coded.

Table 3: Numbers and proportions of admissions by diagnostic group (main diagnosis, England and SW, 1995/96 - 1999/2000
Table 4 shows the number and proportion of admissions by diagnostic group and age for the South West (1995/96-99/2000). In the younger age groups, substances misuse, schizophrenia and related psychoses, eating disorders, and 'other' diagnoses are more prevalent. In the older ages organic disorders, mania and bipolar disorders and depression and anxiety are more prevalent.
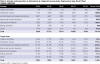
Table 4: Numbers and proportions of admissions by diagnostic group (main diagnosis, by age, SW, 1995/96 - 1999/2000
Table 5 shows the numbers and proportions of admissions by diagnostic group for the South West for males and females. The last column indicates the extent to which this is predominantly a condition experienced/treated in men or women. While overall males account for 51% of admissions, two thirds of admissions for substance abuse are for males whereas 96% of admissions for eating disorders are females.
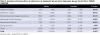
Table 5: Number and proportions of admissions by diagnostic group (main diagnosis, by sex, SW, 1995/96 - 1999/2000
3.2 Length of stay
As length of stay in hospital has considerable resource implications, we investigated the proportion of 16–64 year old psychiatric inpatients who remained in hospital for more than 90 days and more than 365 days by age, sex, diagnosis and Health Authority of residence (using old HA boundaries).
Altogether, over the 5 years studied 8.9% of psychiatric inpatients in England remained in hospital for more than 90 days and 0.9% stayed for more than 365 days (see Table 6). The London region had the highest proportion of long-stay patients. The South West had a similar proportion of patients staying for more than 365 days compared to England, but a slightly smaller proportion staying more than 90 days.
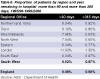
Table 6: Proportion of patients by region and year remaining in hospital more than 90 and less than 365 days, 1995/96 - 1999/2000
Patterns of long stay by age in the South West were similar to those seen nationally (see Table 7). There were considerable age-group differences in the patterns of long stay admissions. Long lengths of stay were most frequent at the extremes of the age distributions studied. This is likely to be accounted for by admissions for early onset psychotic disorders and eating disorders in younger people, and problems associated with ageing (e.g. early onset dementia) in older people.
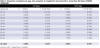
Table 7: Proportion of patients, by age, who remained in hospital for more than 90 or more than 365 days, 1995/96 - 1999/200
Table 8 shows for each diagnostic group the proportion of admissions which result in stays of more than 90 or more than 365 days. For example, in the South West, 18.5% of admissions for eating disorders, almost one in five, lead to an admission of more than 90 days. However, this accounts for only 120 patients over five years. A similar proportion, 17.5% of admissions for schizophrenia and related psychoses, also stay for more than 90 days. However, this accounted for almost 2,500 patients over the five year study period.
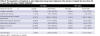
Table 8: The proportion of inpatients in each diagnostic group (main diagnosis) who remain in hospital for more than 90 or more than 365 days, 1995/96 - 1999/2000l
The main condition contributing to prolonged lengths of stay was thus psychosis – this accounted for approximately a half (49%) of the patients who remained in hospital for more than 90 days and two thirds (64%) of those remaining more than 365 days. The main conditions associated with long length of stays were the same in the South West as nationally i.e. organic disorders, psychoses and eating disorders.
Table 9 shows the distribution of long lengths of stay for each of the former Health Authorities in the South West. Over the years studied hospitals serving Avon and Wiltshire Health Authority residents were characterised as having the greatest proportion of patients staying 90 days or more. Whilst the regional average was for 8.6% of patients to remain in hospital for more than 90 days, figures for Avon and Wiltshire were 11.0% and 9.7% respectively. Two of the Health Authorities in the region (Avon and North & East Devon) include forensic units. We therefore repeated these analyses excluding forensic units to see if these contributed to the pattern of long length of stay seen in Avon. The proportion of patients who remained as inpatients for >90 days was slightly reduced in Avon (10.2%) and North & East Devon (7.2%).
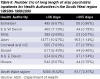
Table 9: Number (%) of long length of stay psychriatric inpatients for Health Authorities in the South West region 1995/96 - 1999/2000
When the analysis was restricted to patients remaining in hospital for >365 days Avon (1.1%) and North & East Devon (1.3%) had the highest proportion of such patients. Removing forensic patients from the analysis resulted in a more even distribution of long lengths of stay across the region – the percentage of patients staying >365 days declined to 0.9% in Avon and 0.6% in North and East Devon.
Length of stay may not only reflect the proportion of total admissions in each diagnostic group but may also be an indicator of the severity of illness. Severity is a factor which cannot be investigated using HES, but which should be borne in mind when interpreting these figures.
Conclusion
In the South West the length of stay for 8.6% of patients exceeded 90 days and for 0.9% it exceeded one year. Psychotic illness is the main cause of prolonged admission. Patterns of long stay in the South West were similar to those seen nationally.
3.3 Admissions within the South West by Health Authority, and by area level deprivation
Table 10 shows the number and proportion of admissions by Health Authority within the South West region over the five-year study period. It also shows similar figures for 1999 only, with crude and age-standardised rates, in order to provide a more recent description of the distribution of admissions at this sub-regional level. These figures indicate that admission rates vary considerably by health authority, with the rate in North & East Devon more than twice that in Wiltshire. Figure 1 shows the age-standardised rates for Health Authorities in 1999 in graphic form.
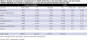
Table 10: Number and proportion of admissions for Health Authorities in the South West region, men and women, 1995/96 - 1999/2000, and number of admissions, %, crude rate and age-standardised rates for 1999
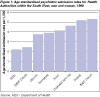
Figure 1: Age-standardised psychiatric admission rates for Health Authorities within the South West, men and women 1999
Variations in admission rates between Health Authorities (1999/2000) are seen for all seven of the diagnostic groups studied (see appendix A). For both depression/anxiety and schizophrenia/related psychoses the highest admission rates were seen in North and East Devon, the lowest in Wiltshire. Dorset had the highest admission rates for drug misuse.
Admission rates also vary substantially by PCT (see Appendix B). Admission rates were highest in Bournemouth (7.0 per 1,000), North Devon (6.0 per 1,000) and Taunton Deane (5.6 per 1,000). They were lowest in South Gloucestershire, Swindon, and Kennet & Wiltshire (all with rates of 2.1 per 1,000). The number of admissions also varies by PCT; combining both numbers and rates gives an indication of the use of psychiatric services at the PCT level.
Variations by deprivation
In order to consider whether admission rates varied according to deprivation, we used the following method. All census wards in the South West were ranked according to their score on the Townsend deprivation index and then grouped into deprivation quintiles; quintile 1 is the most deprived and 5 the least deprived. Age-standardised admission rates (based on European standard population) were then calculated for each of the five quintiles. Table 11 presents these admission rates, with 95% confidence intervals, and Figure 2 shows the admission rates for the five quintiles.
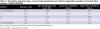
Table 11: Psychiatric admission rates, crude and age-standardised per 1,000, for deprivation quintiles in the South West, persons,
1995/96 - 1999/2000
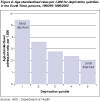
Figure 2: Age-standardised rates per 1,000, for deprivation quintiles in the South West, persons,
1995/96 - 1999/2000
Conclusions
There are around 12,000 hospital admissions under the care of a psychiatrist in this age group each year in the South West. The admission rate of 3.8 per 1,000 per year is higher than the national rate of 3.2 per 1,000. In keeping with national patterns, admission rates are higher in men than women. The main diagnosis in around a third of admissions is depression or anxiety, psychotic disorders account for a quarter of admissions and substance misuse a fifth.
There are marked variations between Health Authorities in admissions – rates vary two fold from 2.2 per 1,000 per year in Wiltshire up to 5.3 per 1,000 in North & East Devon. There are also marked variations by PCT. Psychiatric admission rates vary significantly according to area-level deprivation. In the most deprived fifth of wards in the South West region, rates are 2.6 times higher than in the least deprived fifth of wards.
3.4 Compulsory admissions to hospital under the Mental Health Act (1983)
HES records include a field identifying whether an admission resulted from compulsory detainment under the Mental Health Act (HES field code: "adminstat"). Preliminary examination of levels of compulsory admission, by year and region, identified considerable year on year fluctuations. Furthermore, over the five year period, the annual number of compulsory admissions estimated from HES data were, on average, approximately half that officially recorded on the basis of KP90 forms returned by hospital trusts to the Department of Health (Table 12). However, for the South West in 1999/2000 the shortfall was only very small (39 admissions).

Table 12: Comparison of HES data and KP90 returns for the number of compulsory admissons under the Mental Health Act 1984 (all ages)
Conclusion
Historic (1995/96-1999/2000) HES data were an unreliable means for assessing geographic patterning and time-trends in formal admissions under the Mental Health Act.
Recommendation
In addition to the KP90 forms they routinely return to the Department of Health, mental health trusts within the South West (and elsewhere) should be asked to ensure that information on whether or not a patient was formally detained under the Mental Health Act is routinely recorded on hospital admission databases (HES).
3.5 Use of ECT
ECT administration is recorded within HES data as an operative procedure. To assess the completeness of recording of ECT we contrasted the number of individuals recorded on HES as receiving ECT in 1999 (n=3082) with the findings of a survey of ECT use carried out by the Department of Health in the same year (Department of Health 1999). Over the 3 months of the national survey an estimated 2800 patients received ECT. Thus, over a 12 month period, an estimated 11,200 (4 * 2800) patients receive ECT in England.
Only 27% (3082/11200) of the individuals receiving ECT treatment were identified in our analysis. HES data therefore appears to greatly underestimate the use of ECT. Such under-recording of ECT in HES has been recognised by the Department of Health who have identified two explanations for this (DoH 1999): (i) Many trusts do not realise that ECT should be recorded as an operative procedure; (ii) Mental Health Trusts who do not usually carry out other types of operations do not appreciate that there may be codes relevant to them.
Conclusion
Historic (1995/96–1999/2000) HES data were an unreliable means of assessing geographic patterning and time-trends in use of ECT.
Recommendation
Mental health trusts within the South West (and elsewhere) should be asked to ensure that information on use of ECT is routinely recorded on hospital admission databases (HES).
4 Discussion
It is important to remember that these calculations are based on hospital admissions and it is quite likely that the same person may be admitted a number of times in the same year. However, figures on total admission, supplemented with data on length on stay, can inform us about the level of use of hospital resources.
Whilst this analysis of routinely recorded national psychiatric hospital admission data has identified some problems with data completeness (specifically, with the recording of ECT and admissions resulting from the Mental Health Act), comparison of the general psychiatric admission figures with local and national studies highlights a number of reassuring features. For example, the excess of male over female admissions, representing a reversal of the sex differences in psychiatric admission and bed occupancy seen prior to the 1980s, is confirmed by two recent analyses, one of NHS data (Payne 1995), the other of census data (Prior and Hayes 2001).
The best source of comparator data regarding the distribution of main diagnoses accounting for hospital admission comes from a survey of 730 consecutive acute adult psychiatric admissions in Avon between January and June 1998 (Bartlett et al, 2001). The gender ratio reported in this Avon-based study (52% males, 48% females) is in keeping with the slight male excess observed in these more comprehensive HES data. The distribution of main diagnoses underlying the admissions reported by Bartlett et al was also very similar to those seen in our analysis: depression and anxiety (35%), schizophrenia and related psychoses (26%), mania/bipolar disorder (14%) and substance misuse (11%); these contrast with our figures for the South West in 1998 of 33%, 23%, 11% and 17% respectively (see Table 3).
The quality and completeness of HES data have in the past been questioned, although it is notable that they have been seen to be improving over time (Williams and Mann, 2002). A recent systematic review of discharge coding reported that accuracy is on average high (Campbell et al, 2001), although maintaining and improving coding was seen as an important aim. Certainly in terms of coverage, there is no data source to rival HES, which are increasingly being used by the Department of Health for many purposes, such as the monitoring of variations in activity and identification of trends in health care, the allocation of resource, and more recently producing clinical and performance indicators. HES therefore has great potential to inform the provision and planning of hospital care.
The seven main findings from this report of HES data are:
-
Rates of hospital admission for psychiatric diagnoses in the South West region are somewhat higher than the national average.
-
Rates of psychiatric admission are higher for males than for females, as is the case nationally.
-
In keeping with national patterns, depression/anxiety is the most frequently recorded main diagnosis given as the reason for inpatient admission – accounting for around a third of all admissions, psychoses accounting for a quarter of admissions and substance misuse around 20%.
-
Also in keeping with national patterns, the length of stay for around one in ten patients exceeds 90 days and for around one percent it exceeds one year. Psychotic illness is the main cause of prolonged admission accounting for about half of admissions lasting more than 90 days and two thirds lasting over a year.
-
Within the South West region there are marked variations between Health Authorities in admissions rates, these vary two fold from 2.2 per 1,000 per year in Wiltshire up to 5.3 per 1,000 per year in North & East Devon.
-
Admissions vary significantly by area-level deprivation, such that those living in the most deprived 20% of areas in the region are more than two-and-a-half times more likely to be admitted as a psychiatric inpatient than those living in the least deprived 20% of areas.
-
There is evidence that several aspects of psychiatric hospital admission are poorly recorded in HES. In particular, admissions under the Mental Health Act (1983) and use of ECT are unreliably recorded. Whilst admissions under the Mental Health Act are reliably recorded through routine reporting systems between trusts and the Department of Health (KP90), this information is clearly not well recorded on computerised hospital admission and discharge systems (HES).
5 Implications for service provision and planning
The results presented in this report have important implications for service planning.
These analyses have produced admission rates at regional and PCT level which can be used as a baseline against which to monitor service usage. The breakdown by category of illness and length of stay combined with male and female differences gives even greater detail to inform the planning process particularly about the mix of type of beds which are currently used.
The report highlights significant differences in age standardised admission rates by deprivation. Patients from the most deprived wards have double the admission rates of those from the least deprived. It will be important to investigate how much of this variation is related to the differences in need and how much to differences in levels of in-patient provision, particularly the relationship between in-patient and community services.
The report has highlighted poor levels of reporting in two key areas. Admissions under the Mental Health Act and Electro Convulsive Therapies. Although there are other methods for reporting these interventions, the accuracy of record keeping in these areas is particularly important for clinical governance and should be improved as HES data may be used as a source of identifying numbers of patients admitted for these reasons.
Service planners and commissioners should use these findings in conjunction with National Guidance to assess current provision and monitor developments.
References
Bartlett C, Holloway J, Evans M, Owen J, Harrison G. Alternatives to psychiatric in-patient care: a case-by-case survey of clinical judgements. Journal of Mental Health 2001;10:535–546.
Campbell, SE, Campbell, MK, Grimshaw, JM and Walker, AE. A systematic review of discharge coding accuracy. Journal of Public Health Medicine, 2001;23(3):205–11.
Department of Health. Electro Convulsive Therapy: Survey covering the period from January 1999 to March 1999, England. Statistical Bulletin 1999/22. September 1999.
Department of Health. Inpatients Formally Detained in Hospitals Under the Mental Health Act 1983 and Other Legislation. NHS Trusts, High Security Psychiatric Hospitals and Private Facilities: 2000–01 and 1998–9. Govt. Statistical Service. 1999 and 2002.
Payne S. The rationing of psychiatric beds: changing trends in sex-ratios in admission to psychiatric hospital. Health and Social Care in the Community 1995;3:289–300.
Prior PM, Hayes BC. Changing places: men replace women in mental health beds in Britain. Social Policy and Administration 2001;35:397–410.
Smith P, Sheldon AS and Martin S. An index of need for psychiatric utilization based on in-patient utilization. British Journal of Psychiatry, 1996; 169, 308–316.
Williams, JG and Mann, RY. Hospital episodes statistics: time for clinicians for get involved? Clinical Medicine, 2002; 2(1):34–37.
Acknowledgements
Thanks to Roy Maxwell for providing appropriate population denominators.
Working Group members
Dr David Gunnell – Senior Lecturer in Epidemiology and Public Health Medicine, Department of Social Medicine, University of Bristol
Professor Glynn Harrison – Head of the Division of Psychiatry and member of regional working party on mental health care provision
Davidson Ho – HES data manager, Department of Social Medicine, University of Bristol
Dr Ruth Shakespeare – lead for Mental Health from the Public Health Team, Government Office South West and member of regional working party on mental health care provision
Dr Mary Shaw – Scientific Director, South West Public Health Observatory and Senior Research Fellow, Department of Social Medicine, University of Bristol
Dr Julia Verne – Director, South West Public Health Observatory & Government Office South West.
Appendix A
Number of admissions, crude rate and age-standardised rate for Health Authorities in the South West region by diagnostic group, men and women,
1999/2000 (forensic admissions excluded)

Number of admissions, crude rate and age-standardised rate for Health Authorities in the South West region by diagnostic group, men and women,
1999/2000 (forensic admissions excluded) [Continued]
Appendix B

Number, crude rate and age-standardised rates (per 1,000) of psychiatric admissions for PCTs in the South West region,
1995/96 - 1999/2000
Addresses for correspondence
