Waste management and public health: the state of the evidence
Evidence of an impact on health
4.1 Types of study
In a “weight of evidence” approach to evaluating evidence, greater weight is placed on the conclusions drawn from some types of study over others. Study designs at the top of the hierarchy (see Table 6) are the ones most likely to lead to valid conclusions from which generalisations can be made (CRD 2001, WHO Working Group 2000). Evidence from studies on people is more conclusive than extrapolations from studies on animals, while animal studies carry more weight than studies on parts of organisms outside the body or on related chemicals. Amongst the different kinds of studies on people, the ones higher up the hierarchy, i.e. experimental studies and prospective cohort studies, are useful for testing hypotheses and establishing whether a causal relationship exists. The study designs further down the hierarchy, e.g. observational studies without controls, are useful for generating hypotheses which subsequently need confirmation from study designs further up the hierarchy.
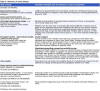
Table 6: Hierarchy of study designs
From some study designs it is possible to infer whether the intention was that the study be a hypothesis-testing or a hypothesis-generating study. For the most part, cross sectional studies are about hypothesis generation whereas cohort and case control studies are concerned with hypothesis testing. However in many cases, the actual execution of the study is flawed in ways that make hypothesis testing problematic. Studies which purport to be hypothesis testing cannot be seriously regarded in that light unless there is evidence in the report that:
a. there is an adequate control group
b. there is adequate exposure data
c. there is clear evidence of an hypothesis to be tested.
Some studies described as cross sectional studies may be better described as cohort studies because they include evidence of a temporal relationship. For example, occupational exposures are necessarily retrospective in nature.
(For a useful description of epidemiological study designs, see Marsh & Caplan 1987, WHO European Centre for Environment and Health 2000 Annex A4.1.)
4.2 Study limitations and confounding factors
It is difficult to establish a cause-and-effect relationship in epidemiological studies in the field of waste management. Particular challenges concern confounding by other unrelated factors that may explain the results as well as the factor under investigation, incompleteness of data, and variability.
4.2.1 Confounding
Confounding takes place when the exposure is associated with some other factor which also increases the risk of the health outcome studied. For example, a positive correlation between breast cancer and pesticide exposure may be confounded by factors such as higher socio-economic status and delayed child-bearing which also apply to the sample under study. It may be possible to adjust for the effects of potential confounding factors if enough detailed data are collected.
Factors which affect exposure
Other sources of pollutants could be a confounding factor, undermining the conclusion linking a particular waste management site to the health outcomes observed in a study. There are few areas where there is only one source of pollutants to which a population is exposed. As well as other environmental pollutants from industrial and traffic pollution, there is usually concurrent exposure to occupational hazards, indoor air pollutants, tobacco smoke, alcohol, prescription drugs and recreational drugs.
Where there are several sources of pollutants, there may well be interactions between the exposures. In the absence of exposure data, models and epidemiological methods cannot clarify what these interactions may be. Exposure to one source of pollutants may potentiate or may suppress the relationship between the other exposure and the health outcome (Marsh & Caplan 1987).
Nant-y-Gwyddon – the conclusion that the landfill site in Nant-y-Gwyddon may have been responsible for an increased rate of congenital abnormalities in residents near the site (Fielder et al 2000) has been challenged by researchers who pointed out that a municipal incinerator operated in the same area just before the landfill site opened (Roberts & Redfearn 2000). There was no direct evidence that the landfill, rather than the poorly performing and heavily polluting incinerator, was the cause of the adverse health outcomes.
Factors which affect health
Matching
– Where there is a control group or reference population, an attempt can be made to adjust for the other factors which may have a significant effect on the health outcome being studied, i.e. age, social class, occupation, race, gender. To adjust for social class, researchers use measures of deprivation such as the Carstairs deprivation index which is based on social class, unemployment, access to a car, and overcrowding (used by Elliott et al 2001). McNamee and Dolk (McNamee & Dolk 2001) point out that the Carstairs index may not be an adequate proxy measure for all relevant risk factors and that failure to account for important risk factors could substantially distort the relative risks, especially if the relative risks are small as they were in the SAHSU study (Elliott et al 2001).
Symptoms
– Many studies are of self-reported symptoms but these studies do not clarify the cause of the higher symptom rates. Miller points out that there may be several explanations for higher symptom rates in communities near waste management facilities other than toxicological or immunological reactions to pollutants (Miller 1996). The increased rate may be due to psychosomatic reactions to the stress brought on by the presence of a nearby facility, mass psychogenic illness as a reaction to publicity relating to the site, recall bias and confounding factors that have not been identified or considered in the analysis.
Biomarkers
are becoming more popular as a way of indicating exposure and as predictors of outcome. However, there is uncertainty about the interpretation of positive biomarker results and lack of knowledge about how long the abnormalities persist after exposure. For some biomarkers, exposure must be current or very recent to be detectable. In the case of chromosomal damage, exposure to pollutants may cause DNA damage, leading to DNA repair problems. This can be detected in cytogenetic challenge studies. The assumption is that individuals with an abnormal cytogenetic response are defective in DNA repair and thus have an increased risk for cancer. However, there is no proof of this association. Many other ubiquitous agents such as sunlight and X-rays cause DNA damage, the rate of DNA repair is not known and laboratory conditions can affect the amount of damage. (For a useful discussion of the use of biomarkers in studies of waste sites see WHO European Centre for Environment and Health 2000 Annex 5.)
4.2.2 Incompleteness of data
Exposure data
Most studies have no exposure data whatsoever, using residence near the site based on postcodes or census tracts as a surrogate for actual exposure measurements. Residence, however, is an inadequate and crude substitute. Misclassification can occur if people move into or out of the area during the time they were meant to be exposed. Leachate from a landfill site may contaminate groundwater or surface water and affect a much wider population living further away. People living upwind may be minimally exposed to air pollutants compared to those living downwind. In some studies, residence selection is refined slightly to account for this. Where exposure data are absent, the reliability of any conclusions drawn is substantially weakened.
Love Canal – residence in a Love Canal census tract was used as a surrogate measurement of exposure in most Love Canal studies (Janerich et al 1981, Vianna & Polan 1984, Goldman et al 1985, Paigen et al 1985, Paigen et al 1987). There was one study which used actual measurements of chemicals likely to have arisen from the canal (Heath et al 1984). This study reported no differences in chromosome aberrations in 46 people who lived in houses where chemicals were detected compared with people who lived in an adjacent census tract. However, the exposure data were limited as there were no data on how long and sustained the exposure was.
Nant-y-Gwyddon – residence within five electoral wards within 3 km of the landfill site was used as a surrogate measurement of exposure (Fielder et al 2000).
Defining the exposed population is fraught with difficulties but is necessary to establish the denominator from which an incidence rate can be calculated. If groundwater is contaminated, communities far from the waste site may be drinking the water and the exposed population may in fact be greater than those living within 2 km of the site. However, the concentration of contaminants in groundwater far from the site will be very small and thus it will be even harder to pick up health effects. In many studies, there are large gaps between exposure and the start of the study. Immediate health problems can be missed and people move out of the area making it hard to trace them.
Studies without a control group can prove very little as health is strongly affected by characteristics such as race, social class, smoking, alcohol use, age, sex, diet and occupation which have little to do with exposure to contaminants from waste management sites. It is difficult to find an appropriate control group matched for all confounding risk factors. Most important, the control group should not be exposed to hazards either from the waste management site being studied or other ones in the area.
Love Canal – a study by the New York State Department of Health found no evidence for higher cancer rates in Love Canal residents than in the state of New York as a whole or in the city of Niagara Falls of which Love Canal is a part (Janerich et al 1981). The study was done by examining data from a standardised reporting system, the New York Cancer Registry, whose completeness and accuracy could not be guaranteed. The exposed population was not well defined as the study was based on census tracts which did not correspond exactly to proximity to Love Canal nor did it include people who had left the area. The US Environmental Protection Agency commissioned a cytogenetic study of Love Canal residents which showed an increase in chromosome damage (Picciano 1980). The study was subsequently discredited as having virtually no scientific validity because the control group was not matched with Love Canal residents and because they were not tested simultaneously (Kolata 1980). A later study with proper controls showed no difference in chromosome damage between exposed people and the control group (Heath et al 1984).
Nant-y-Gwyddon – the control group was the population in 22 wards in the same authority matched for Townsend deprivation score. The exposed population was slightly less deprived by this socioeconomic measure than the comparison group (Fielder et al 2000).
Health outcome data
Unreliability
– Data about health outcomes may be incomplete or unreliable for a number of reasons with major implications for the conclusions reached in the epidemiological studies. Data on congenital malformations and stillbirths are highly dependent on the motivation by health authorities to notify to the register, to changes in reporting criteria and to definitions used. When discussing the issues limiting the reliability of the conclusions from the SAHSU study (Elliott et al 2001), the authors mention over-reporting of anomalies in Scotland, under-reporting of anomalies in England and Wales and changes in the rules about which malformations were notifiable.
Recall bias
inevitably leads to over-reporting in communities where people are worried about the health effects of a waste site. People are already aware of and looking out for health problems. Recall bias is especially important for symptoms but less so for other conditions with more objective measurements such as low birth weight. The limitations of using health outcome data based on recall is described in a study of 22 people exposed to fumes from ruptured drums containing nitric acid during a hazardous waste site clean-up operation (Hopwood & Guidott 1988). The people were interviewed immediately after the incident by emergency room staff, the next morning by a researcher and six months later. There was a low level of agreement between the symptoms reported six months after the incident and those reported at the time. The trend was not random. Subjects consistently recalled more symptoms in the later interview.
Love Canal – from informal surveys carried out by the residents of Love Canal, a long list of health impacts was produced. On the list were birth defects, deafness, rashes, headaches, cancer, epilepsy-like seizures, nervous disorders, miscarriage, asthma, liver damage, the death of a child from kidney failure and a case of nausea, thick perspiration and sores (Brown 1980).
Latency periods
– Studies of illnesses such as cancer which have a long latency period can lead to false negatives if not followed for a sufficient period of time. Latency periods may be in the order of one year for childhood leukaemia, several years for adult leukaemia and longer for solid tumours (Elliott et al 2001). For fetal exposure to hormone-disrupting chemicals, the latency period may be even longer.
Colborn argues that fetal exposure may "derail development in a variety of ways that will become evident at different times, e.g. a boy exposed may have undescended testicles at birth, low sperm count at puberty or testicular cancer in middle age."
(Colborn et al 1997)
Love Canal – A limitation of the Janerich study (1981) was that exposure from chemicals leaking from Love Canal was greatest during the 1970s. Cancers appearing 10 to 15 years later would not have appeared in that study which used data only up until 1977. In a study of chromosomal aberrations (Heath 1987), measurements of the chemicals were made in 1978 but the chromosome tests were not carried out until 1980. It is not clear how long after exposure cytogenetic damage persists and can be detected.
Sample size and statistical power
The population affected by a particular waste site is usually small. This limits the range of health effects and the number of cases that can be observed. The rarer the disease, the larger the exposed and control group need to be in order to detect a significant increase among the exposed. To design an epidemiological study looking for a doubling in reproductive effects with a probability of less than 0.05 (p<0.05), the size of the exposed and control groups need to be:
Miscarriage 15% recognised pregnancies
160 pregnancies
Minor birth defects 10% live births
266 live births
Major birth defects 2% live births
1525 live births
Club foot 0.6% live births
5199 live births
(Zielhuis 1985)
In a review of published public health investigations at 16 hazardous waste sites in the United States, only two studies included more than 1000 people while the rest had fewer than 500 people (Levine and Chitwood 1985).
Love Canal – a statistically significant excess of low birth weight was found in babies living along the swales by Love Canal from 1940 to 1953 when the landfill was active. From 1954 to 1978, there was no difference in birth weight between babies born in the Love Canal area and the rest of upstate New York. Included in the study were 383 women who had a total of 617 children and who lived in the study area from January 1940 through June 1978 (Vianna and Polan 1984).
Single site studies are limited in their statistical power to detect excess risks for rare health outcomes. Multi-site studies increase statistical power but have other problems. They may dilute out adverse health outcomes, obscuring a few highly polluting sites amongst the statistical average. Even in a study with an impressively large sample size, the observed increase in risks could be due to study bias. The recent British study of reproductive outcomes among women living within 2 km of landfill sites included about 8 million pregnancies and 9,565 landfill sites (Elliott et al 2001). Statistically significant excess risks of congenital abnormalities were found. However, the excess risks were so small, i.e. less than 10%, that they could be explained by other biases in the data (McNamee & Dolk 2001).
4.2.3 Variability
Variability is defined as the "individual-to-individual differences in quantities associated with the predicted risk" (National Research Council 2000).
Variability in human populations
Unlike laboratory animals which are bred for homogeneity, the exposed human population is heterogeneous. Children, fetuses, women of child-bearing age and the elderly are particularly sensitive. Children are not just small adults but differ in body composition and maturity of biochemical and physiological functions (Hansen et al 1998). The fetus is particularly vulnerable. Many chemicals cross the placenta and can affect development without obvious effects on the mother. Young children exposed to lead in soil are more at risk than adults because of their behaviour which leads to ingestion of lead from dirty hands and toys. Adults over 40 years are more susceptible to carbon monoxide exposure because a small proportion have decreased cardiovascular capacity.
As well as differences across age-groups, inter-individual variation affects an individual's predisposition to health outcomes. The interaction between genes and the environment affects people's resistance or sensitivity to a range of chemical and physical insults and may explain why some families living near a waste site are affected while others are not and why within these families, some individuals are affected while others are not.
Variability of waste procedures
Unlike a health care intervention, waste management methods are not controlled processes but broad categories with large variations between individual facilities and large gaps in the information available. Waste management sites vary from facility to facility and from country to country with regard to:
•
What goes in
The composition and feed rate of wastes treated.
•
How the waste is treated
Operating practices, age of facility, waste disposal technology used, frequency of off-normal emission events, gas and leachate control systems.
•
What comes out
The type and amount of pollutants emitted, climate affecting atmospheric dispersion, landscape data affecting migration through soil and water, facility data, pollution-control technologies in use.
•
How the emissions reach people – the exposure route
Transfers by deposition and partitioning to exposure media – extent to which groundwater is extracted for drinking water, human activities which bring people into contact with pollutants – consumption of locally grown food, consumption of drinking water, contact with soil, construction of homes close to the site, occupational exposure, etc., proximity to other sources of pollutants.
4.2.4 Conclusion
Whilst it is technically possible to detect the presence of health hazards in waste sites and health impacts among people working or living nearby, there are many problems demonstrating the relationship between exposure and the health impacts observed. The main limitations of epidemiological investigations are the small sample size, lack of exposure information, lack of toxicological data about mixtures of chemicals and the lack of specificity of indicators of adverse health effects.
Even in the case of Love Canal, where contamination was undisputed and great efforts were made to study possible health effects, the studies did not show an alarming increase in ill health.
Given these limitations, there will always be a high level of uncertainty about the health risks to people exposed to hazards from waste management sites.
4.3 The strength of the association
An association, even if statistically significant, is not proof of causation. To determine causation, the cause must precede the effect and the association should be "consistent, unbiased, strong, graded, coherent, repeated, predictive and plausible" (WCRF & AICR, 1997). The strength of the association is an important part of assessing causality, but other factors must be taken into account: consistency of the observed association, speciality of association, temporal sequence of events, dose-response relationship, biological plausibility of the observed association and experimental evidence (Lilienfield 1994).
4.3.1 Relative risk
Relative risk, RR, is a measure of the strength of the relationship between two variables, usually the proposed cause and effect. For example, it is the ratio of the risk or incidence of a disease among people with a particular characteristic (say, residents living near an incinerator) to that among people without that characteristic (say, residents living far from the incinerator).
• A relative risk of less than 1 implies a protective effect.
• A relative risk of more than 1 implies an increased risk. For example, a RR of 2 indicates a doubling of the risk. A RR of 1.1 indicates a 10% increase.
• A relative risk of 1 implies no effect.
Small relative risk values, those less than two, may be important when the number of affected people is large or the disease is very common and when confirmed in several large, well-designed studies. Because observational studies are plagued by biases, uncertainties and confounding factors, many epidemiologists believe that epidemiological studies may be inherently incapable of accurately discerning weak associations. As Michael Thun, the director of analytic epidemiology for the American Cancer Society, puts it, ‘With epidemiology you can tell a little thing from a big thing. What's very hard to do is to tell a little thing from nothing at all.’ (Quoted in Taubes 1995.)
The odds ratio, OR, is another way of expressing the size of the effect. It is the ratio of the odds of an effect in the exposed group compared to the odds in the control group. When the rates are very low or very high, the odds ratio is very similar to the relative risk (CRD 2001).
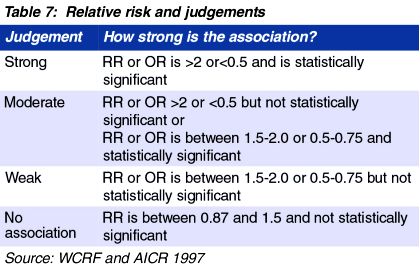
Table 7: Relative risk and judgements
Relatively few environmental factors have been conclusively shown to cause health impacts and examples are shown in Table 8.
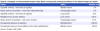
Table 8: Examples of environment factors where there is strong and conclusive evidence of an adverse impact on health
By contrast, many studies about waste and health have relative risks of less than 1.5. (see Table 9).

Table 9: Examples from studies on waste management and health
